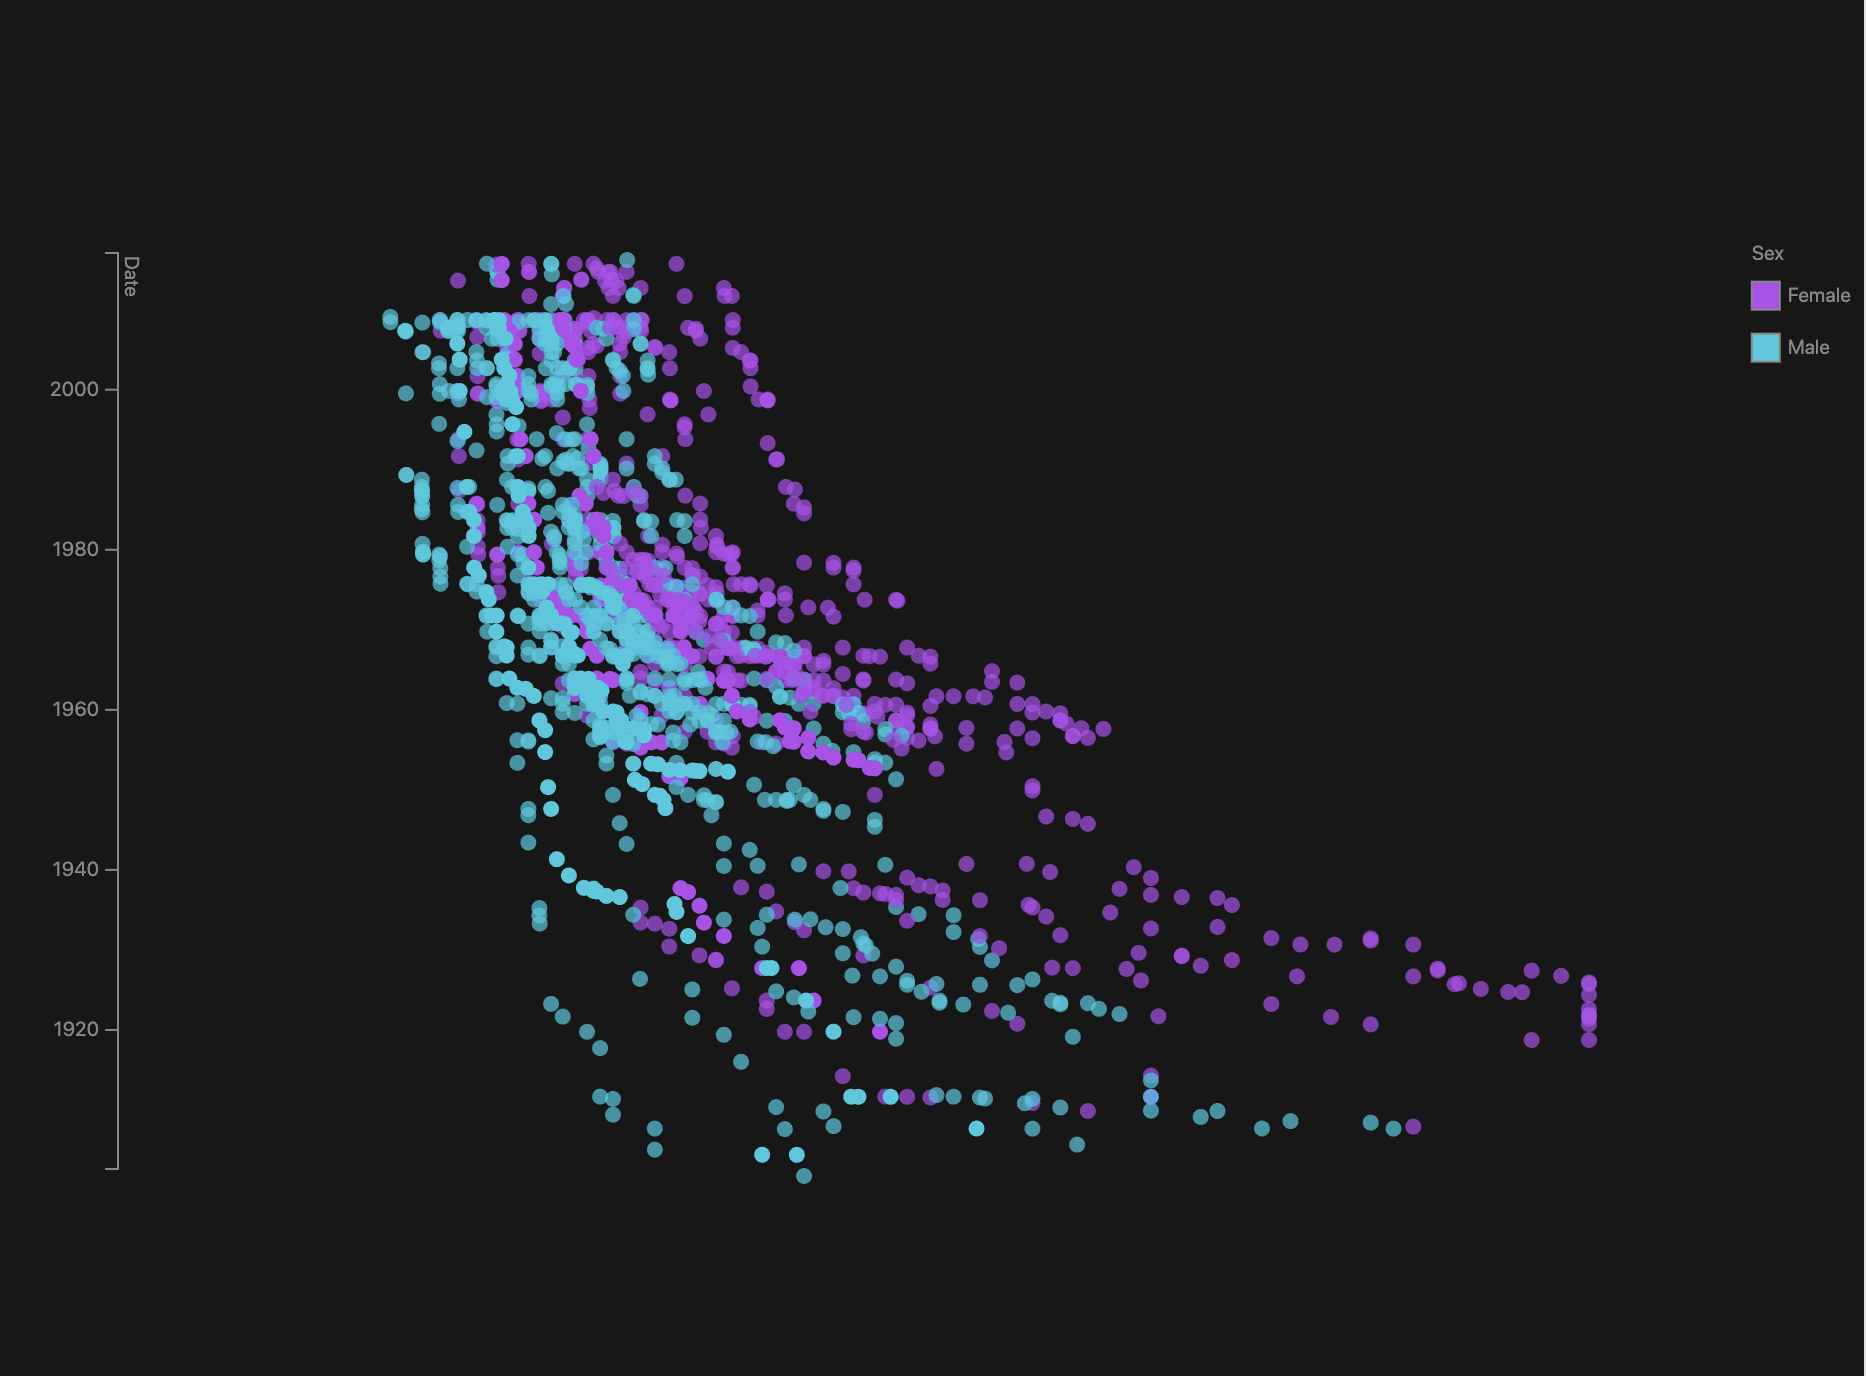
This series of animations shows how swimming world records compare throughout history. Each circle represents a swimming world record time. The first animation shows if all world records competed against each other in a 50m swimming pool by encoding the average speeds of all the records to the speed of the animation. The second animation shows how speed has improved over time.
Original version created by Irene de la Torre Arenas.
Vis Boards
Download Static Vis Boards (*.diproj) for the Swimming World Records throughout History example.
Creation Process
Final Version