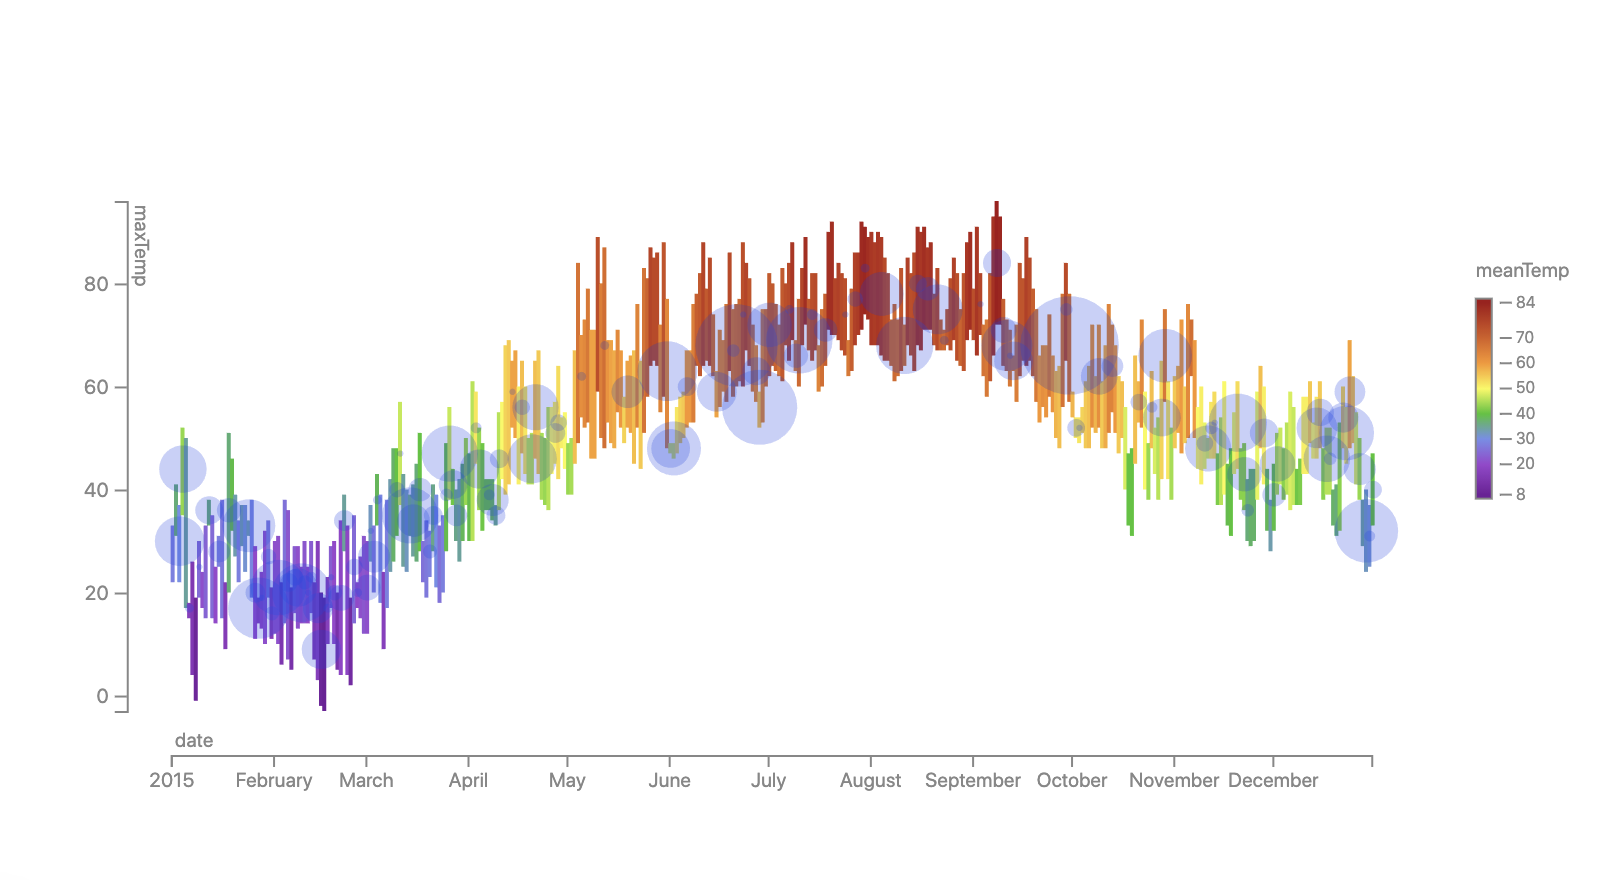
A series of range charts and bubble charts showing the daily temperature and rainfall of Boston for a year.
Original inspiration comes from Weather Radials by Timm Kekeritz was in the Polar space, we demonstrate how to create similar designs in the Cartesian space.
Vis Boards
Download Static Vis Boards (*.diproj) for the Boston Weather in a Year example.
Creation Process
Final Version